Apache JMeter, a powerful open-source tool, is your go-to solution for performance testing. Whether you’re building a website, an application, or a web service, JMeter helps you ensure your system can handle the load and deliver a smooth user experience.
Table of Contents
JMeter empowers you to simulate real-world user traffic, analyze performance bottlenecks, and identify areas for optimization. Its intuitive interface and comprehensive features make it accessible for both beginners and experienced testers.
Apache JMeter Introduction

Apache JMeter is an open-source performance testing tool designed to load test functional behavior and measure performance. It is a popular choice for developers and testers due to its versatility and ease of use.
JMeter allows users to simulate a high load on a web server, network, or other applications, providing valuable insights into system performance under stress. It can be used to identify bottlenecks, analyze response times, and ensure the application’s stability under various load conditions.
Benefits of Using Apache JMeter
JMeter offers several advantages for performance testing:
- Open-Source and Free: JMeter is free to use and distribute, making it accessible to all. This eliminates the need for expensive commercial tools.
- Cross-Platform Compatibility: JMeter runs on various operating systems, including Windows, Linux, and macOS, ensuring compatibility across different environments.
- Versatile Functionality: JMeter supports various protocols, including HTTP, HTTPS, FTP, JDBC, LDAP, and more, allowing users to test a wide range of applications.
- Comprehensive Reporting: JMeter provides detailed reports on performance metrics, including response times, throughput, error rates, and more, enabling users to analyze and identify performance issues.
- Extensible Architecture: JMeter allows users to extend its functionality through plugins and custom code, enabling advanced testing scenarios.
Types of Performance Tests Conducted with JMeter
JMeter can be used to conduct various performance tests, including:
- Load Testing: Simulates a large number of users accessing the application simultaneously to assess its performance under heavy load.
- Stress Testing: Pushes the application beyond its normal capacity to identify its breaking point and assess its stability under extreme conditions.
- Endurance Testing: Tests the application’s ability to handle sustained load over an extended period, revealing potential performance degradation or resource leaks.
- Spike Testing: Simulates sudden bursts of traffic to evaluate the application’s response to rapid changes in load.
- Functional Testing: Validates the application’s functionality under load, ensuring that it behaves as expected under stress.
Setting Up and Configuring JMeter: Apache Jmeter

JMeter is a powerful open-source tool used for performance testing. It’s easy to set up and use, making it an excellent choice for both beginners and experienced testers. This section will guide you through the installation and configuration process, including creating a basic test plan and customizing its settings.
Installing JMeter
Before using JMeter, you need to install it on your system. JMeter is platform-independent, meaning it runs on various operating systems like Windows, macOS, and Linux. Here are the steps to install JMeter:
- Download JMeter: Visit the official Apache JMeter website and download the latest version for your operating system. You’ll find the download links on the “Downloads” page.
- Extract the Archive: After downloading, extract the contents of the downloaded archive (ZIP or TAR.GZ) to a desired location on your system.
- Run JMeter: Navigate to the extracted directory and find the “bin” folder. Inside, locate the “jmeter.bat” file (for Windows) or “jmeter” file (for other operating systems) and double-click it to launch JMeter.
Configuring JMeter
Once JMeter is installed, you can configure it to meet your testing needs. This involves setting up various options and preferences. Here are some essential configurations:
- Language Settings: JMeter supports multiple languages. You can change the interface language by going to “Options” > “Choose Language” and selecting your preferred language.
- Proxy Settings: If you’re behind a proxy server, you need to configure JMeter to use it. Go to “Options” > “Proxy Settings” and enter your proxy server details.
- Logging Levels: JMeter provides different logging levels to control the amount of information logged. You can adjust the logging level in “Options” > “Log Viewer” to suit your needs.
Creating a Basic Test Plan
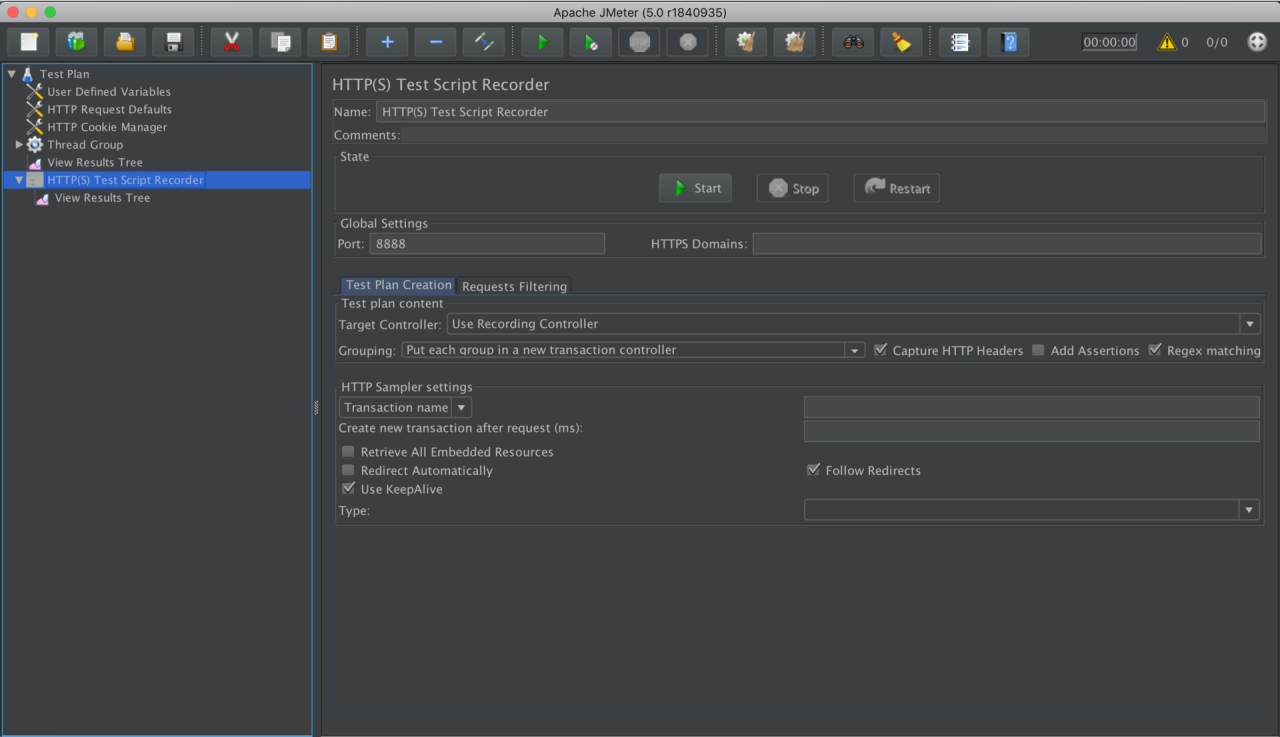
A test plan in JMeter is a collection of elements that define the test scenario. It includes elements like thread groups, samplers, listeners, and assertions. Here’s how to create a basic test plan:
- Create a New Test Plan: Launch JMeter and click on “File” > “New” > “Test Plan”. This will create a new test plan in the JMeter workspace.
- Add a Thread Group: Right-click on the test plan and select “Add” > “Threads (Users)” > “Thread Group”. This element defines the number of virtual users that will participate in the test.
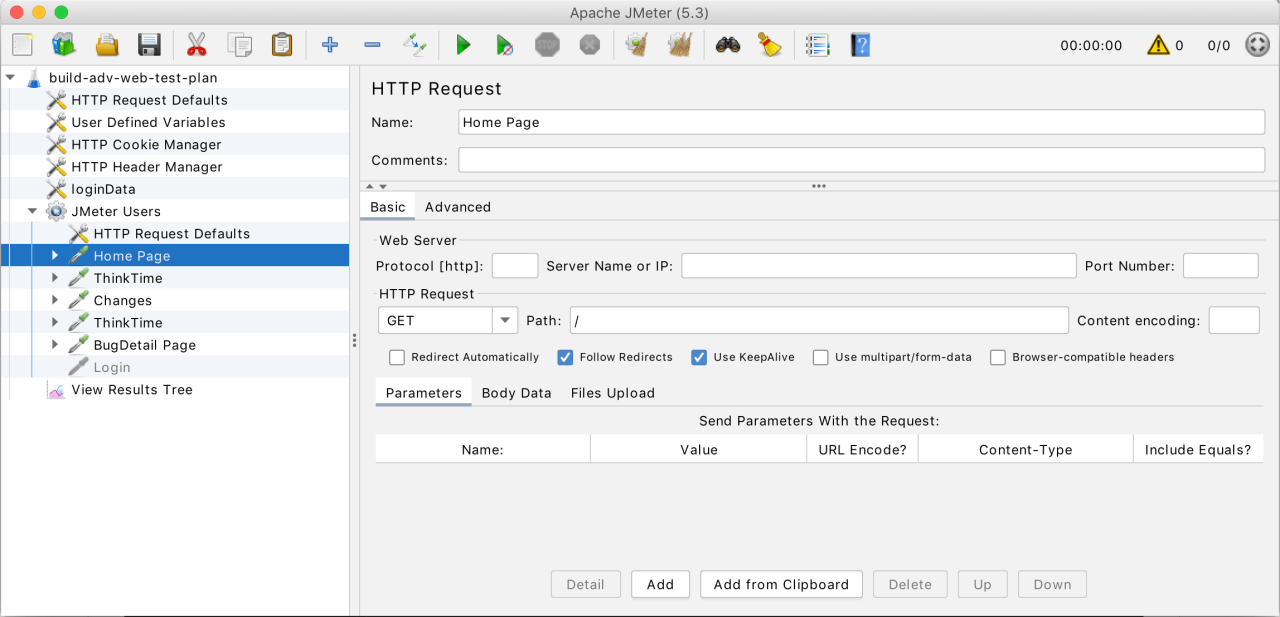
- Add a Sampler: Right-click on the thread group and select “Add” > “Sampler” > “HTTP Request”. This element defines the request that will be sent to the target server.
- Add a Listener: Right-click on the thread group and select “Add” > “Listener” > “View Results Tree”. This element displays the results of the test, including response times and errors.
Configuring Test Plan Settings, Apache jmeter
Within the test plan, you can configure various settings to customize the test execution. Here are some important settings:
- Thread Group Settings: In the “Thread Group” element, you can configure the number of threads (virtual users), ramp-up period, loop count, and other parameters. These settings define the load that will be applied to the server.
- HTTP Request Settings: In the “HTTP Request” element, you can specify the target server’s URL, protocol, method (GET, POST, etc.), path, and other request parameters.
- Assertion Settings: Assertions are used to validate the responses received from the server. You can add assertions to the test plan to check for specific conditions, like response codes, response text, or response headers.
- Listener Settings: Listeners display the results of the test. You can configure listeners to show different types of data, like response times, errors, or response headers.
Implementing Parameterization and Variables
Parameterization in performance testing is crucial for creating realistic and repeatable test scenarios. It allows you to dynamically vary input data, user actions, and other test parameters, simulating real-world user behavior. By parameterizing your tests, you can ensure that your results are accurate and representative of your application’s performance under different conditions.
Using Variables and CSV Data Set Config
Parameterization in JMeter involves using variables to represent dynamic values. The CSV Data Set Config element is a powerful tool for managing these variables.
- CSV Data Set Config: This element allows you to read data from a CSV file and store it in variables. You can then use these variables in your test requests.
To implement parameterization using CSV Data Set Config, you can follow these steps:
1. Create a CSV file: The CSV file should contain the data you want to use for parameterization. Each row in the file represents a set of values for the variables.
2. Add CSV Data Set Config: In your JMeter test plan, add a CSV Data Set Config element.
3. Configure the element: Specify the path to your CSV file, the delimiter used in the file, and the variable names that will hold the data.
4. Use the variables: In your test requests, use the variable names defined in the CSV Data Set Config element.
Example: Using Variables for Dynamic Data Input
Imagine you want to test the performance of a login functionality. You can parameterize the username and password using a CSV file and variables.
1. Create a CSV file (login_data.csv):
“`csv
username,password
user1,pass1
user2,pass2
user3,pass3
“`
2. Add CSV Data Set Config:
– Filename: login_data.csv
– Delimiter: ,
– Variable Names: username, password
3. Use the variables in your login request:
– In the HTTP Request sampler, set the username and password fields to $username and $password, respectively.
By running this test, JMeter will read each row from the CSV file and use the corresponding username and password to perform the login request. This simulates different users logging in, providing a more realistic performance test.
Note: Parameterization is essential for simulating realistic user behavior, enhancing test accuracy, and ensuring repeatable results. It helps to avoid hardcoding values and makes your tests more flexible and maintainable.
Analyzing and Interpreting Results

After executing your JMeter tests, the next crucial step is analyzing the results to understand your application’s performance. JMeter provides a comprehensive set of metrics and visualization tools to help you identify performance bottlenecks, areas for improvement, and overall system health.
Key Metrics to Analyze
Understanding the key metrics provided by JMeter is essential for effectively interpreting test results. These metrics offer insights into various aspects of your application’s performance, helping you identify areas that require optimization.
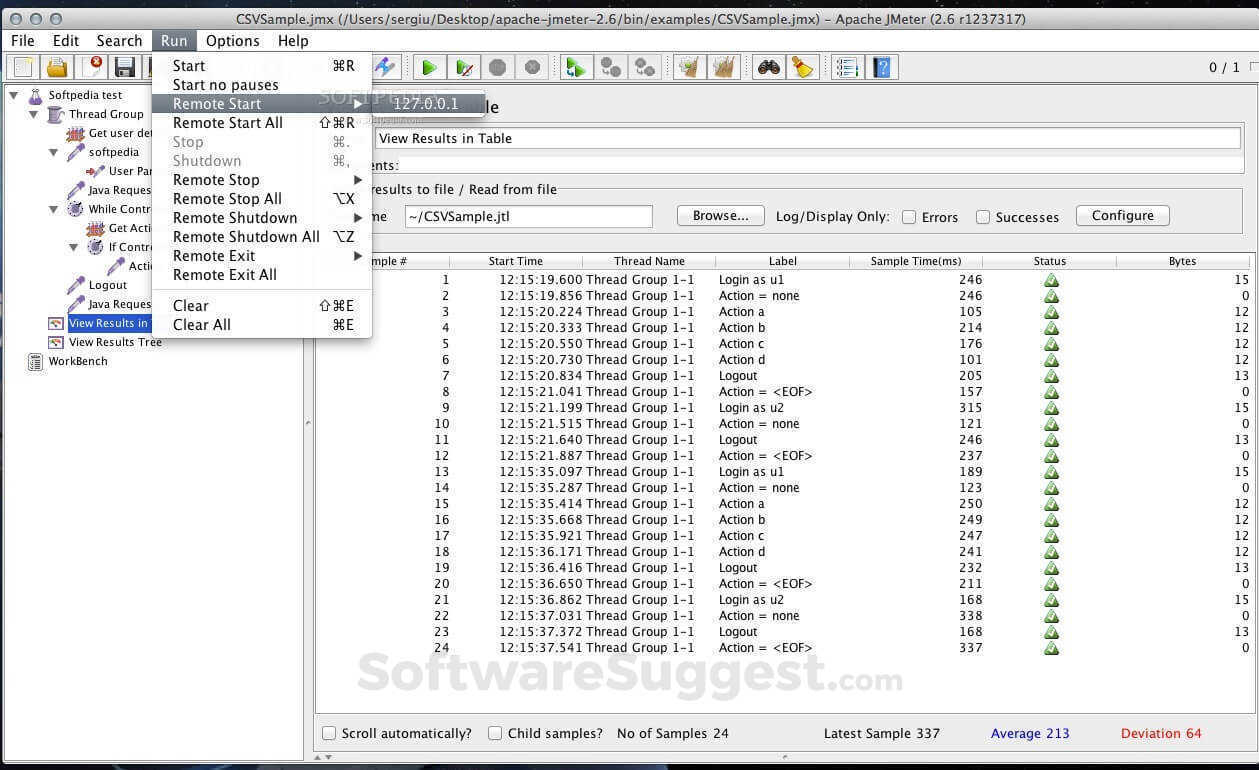
- Sample Time: This metric represents the time taken for a single request to complete, from the moment it’s sent to the server until the response is received. A lower sample time indicates better performance.
- Average: The average sample time across all requests within a given sample. This metric provides a general overview of the request completion time.
- Min and Max: The minimum and maximum sample times encountered during the test. These values help identify outliers and potential performance issues.
- Throughput: This metric indicates the number of requests per unit of time (e.g., requests per second, requests per minute) processed by the server. A higher throughput generally indicates better performance.
- Error Rate: The percentage of requests that resulted in errors. A high error rate suggests potential problems with the application or server.
- Response Time: The time taken for the server to process a request and send a response. This metric is often used in conjunction with sample time to understand the server’s performance.
- Latency: The time taken for the first byte of the response to arrive at the client. This metric is particularly important for understanding network performance.
Interpreting Performance Data
JMeter provides various graphical representations and tables to visualize test results. Analyzing these visualizations helps identify trends, patterns, and areas of concern.
Graphs
JMeter offers several graphs to visualize performance data, each providing unique insights:
- Aggregate Graph: This graph displays key metrics like sample time, error rate, and throughput over time. It helps identify overall performance trends and potential bottlenecks.
- Response Times Over Time: This graph shows how response times vary over the duration of the test. It helps identify performance degradation or fluctuations over time.
- Response Times Percentiles: This graph displays the distribution of response times, highlighting the percentage of requests that fall within specific time ranges. It provides insights into the variability of response times.
- Threads: This graph shows the number of active threads over time. It helps understand the load placed on the server and identify potential thread starvation issues.
Tables
JMeter also provides tables summarizing performance data for each sampler. These tables provide detailed information about each request, including:
- Label: The name of the sampler, identifying the specific request.
- # Samples: The number of requests executed for the sampler.
- Average: The average sample time for the sampler.
- Min: The minimum sample time for the sampler.
- Max: The maximum sample time for the sampler.
- Error%: The percentage of requests that resulted in errors for the sampler.
- Throughput: The throughput for the sampler.
- Received KB/sec: The average data transfer rate in kilobytes per second for the sampler.
Identifying Performance Bottlenecks
By analyzing the key metrics and visualizations, you can identify potential performance bottlenecks in your application. Here are some common areas to investigate:
- Slow Database Queries: If response times are high, and the database is a significant component of your application, you might have slow database queries. Analyze database logs or use profiling tools to identify slow queries and optimize them.
- Network Latency: High latency values indicate network performance issues. Consider optimizing network infrastructure or reducing the number of network hops to improve latency.
- High CPU Utilization: If your server’s CPU utilization is consistently high, it might indicate a resource constraint. Optimize your application’s code or consider upgrading server hardware.
- Memory Leaks: Memory leaks can lead to performance degradation over time. Use profiling tools to identify memory leaks and address them in your application code.
- Application Code Inefficiencies: Inefficient application code can contribute to slow response times. Use profiling tools to identify bottlenecks in your code and optimize them.
Optimization Strategies
Once you’ve identified performance bottlenecks, you can implement optimization strategies to improve your application’s performance. Here are some general approaches:
- Caching: Caching frequently accessed data can reduce the load on your server and improve response times. Consider using caching mechanisms like in-memory caching or content delivery networks (CDNs).
- Code Optimization: Optimize your application’s code for performance. Use profiling tools to identify bottlenecks and refactor code for efficiency.
- Database Optimization: Optimize your database queries, indexes, and schema to improve database performance.
- Load Balancing: Distribute load across multiple servers to prevent overload and improve scalability.
- Hardware Upgrades: If your server hardware is a bottleneck, consider upgrading to more powerful hardware to handle increased load.
Last Point
By mastering Apache JMeter, you gain a valuable tool to assess the performance of your digital products and services. Whether you’re a developer, QA engineer, or performance testing specialist, JMeter provides the insights you need to build robust and reliable systems.
Apache JMeter is a powerful tool for testing the performance of web applications. It can simulate a large number of users accessing a website or application, allowing you to identify bottlenecks and areas for improvement. While JMeter focuses on technical performance, if you’re looking to create and record music, you might want to check out Cakewalk by Bandlab , a comprehensive digital audio workstation.
Returning to JMeter, its ability to generate detailed reports helps developers understand how their application performs under different load conditions.
